

The Insurance Inflection Point: From Endless AI Pilots to Scaled, IoT-Powered Impact
Introduction: The pilot purgatory is over
For years, insurers have run proof-of-concepts for pricing models, claims bots, and fraud analytics—often with real promise but limited business impact. The HBR perspective is blunt: stop running so many pilots; pick the winners and scale them. Deloitte’s 2026 global insurance outlook echoes the same: the industry faces margin pressure, broker consolidation, severe weather, talent shifts, and an AI arms race—all while customer expectations surge. The message is clear: AI only creates advantage when it’s embedded in the operating model.
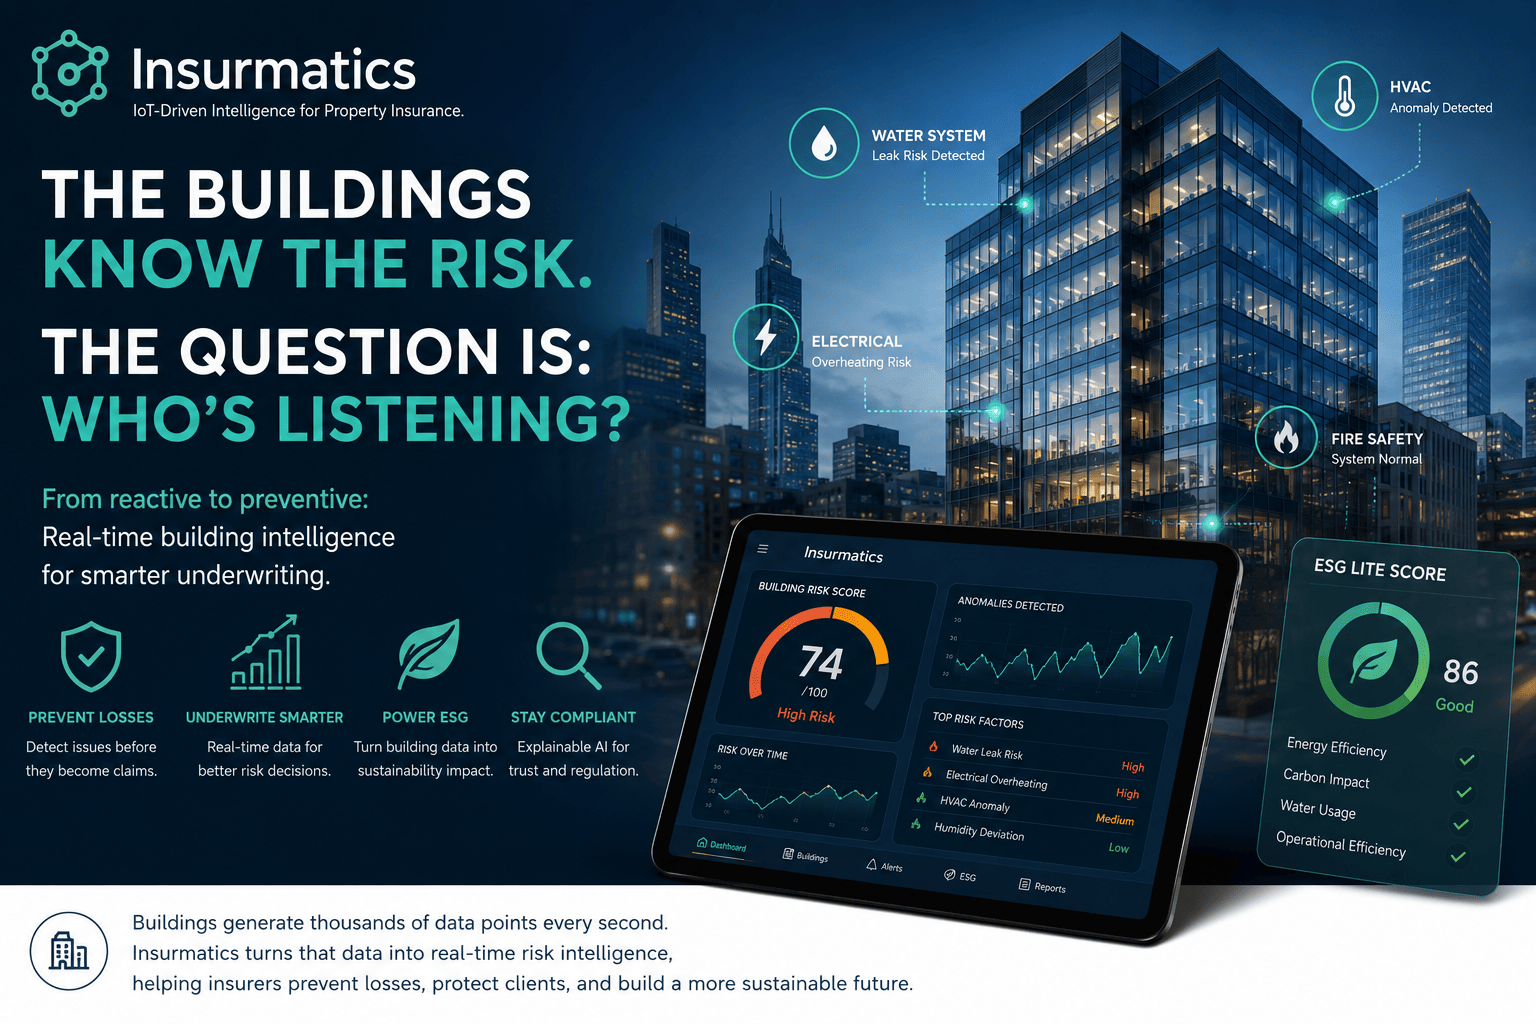
That is precisely where Insurmatics fits: we connect real-world IoT signals (buildings, equipment, IAQ, energy, water, occupancy)—normalize them through open protocols (MQTT/Modbus/BACnet)—and drive AI-agent actions and ESG evidence that stand up to audit and underwriting scrutiny. The result is a practical path from pilot to platform, and from reactive payout to predict-and-prevent.
What’s different now (and why scaling wins)
Deloitte’s 2026 outlook highlights five realities reshaping insurance:
Margin pressure despite a softening hard market
Rates stabilize but costs keep rising: supply-chain friction, litigation funding, social inflation, and reinsurance tightening. Combined ratios edge up; capacity is choosy.Distribution consolidation & new entrants
Aggregators and PE-backed platforms drive tougher negotiations and demand digital-first servicing—and speed.Catastrophe volatility & the protection gap
Wildfire, flood, severe storms escalate loss uncertainty; the global protection gap widens. Regulators push “science-based” risk models.AI ambitions vs. data reality
AI pilots abound; at-scale value lags. Foundations—data quality, security, cloud—decide outcomes. Some carriers adopt “agentic AI” in underwriting and claims triage.Workforce re-design
Human-AI collaboration, right-channel service, and empathy at scale become core to retention and growth.
Translation: AI has to move from cool demos to plumbing + product. That means live data, clear governance, performance obligations—and measurable financial lift.
From pilots to platforms: the Insurmatics blueprint
Insurmatics was built for moment—turning building and equipment data into operational and insurable outcomes that scale across portfolios.
1) Connect & normalize (kill data silos)
What we do: Stream data from BMS and sensors via MQTT / Modbus / BACnet; unify meters (electricity/gas/water), IAQ, temperature, vibration, occupancy.
Why it matters: Standardized telemetry is the backbone of underwriting evidence, loss prevention, and audit-ready ESG reporting.
2) Govern & secure (earn trust early)
What we do: Role-based access, lineage, encryption in transit/at rest, data retention policies, and evidence trails.
Why it matters: Regulators, reinsurers, and enterprise buyers demand a clean data chain; without it, AI never gets past sandbox.
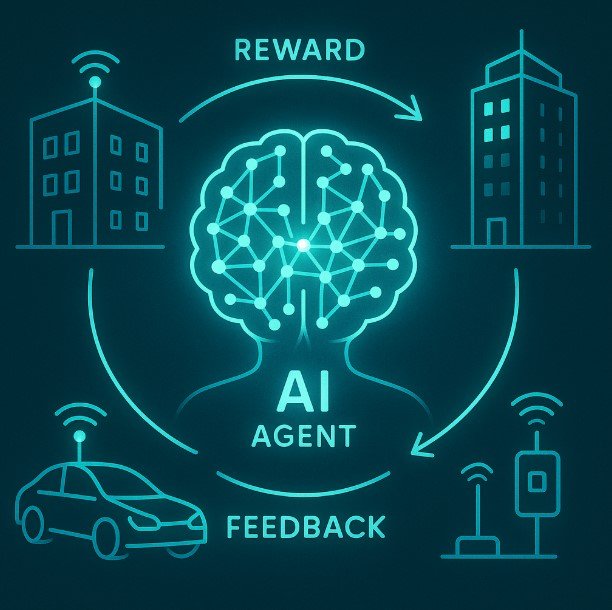
3) AI-agent actions (move from alerts to outcomes)
What we do: Agentic AI detects anomalies (e.g., overnight baseload spikes, moisture signatures, IAQ excursions), recommends fixes with quantified ROI/impact, triggers work orders, or adjusts setpoints where safe/allowed.
Why it matters: This is where pilots become P&L: verified saves, fewer claims, better experience.
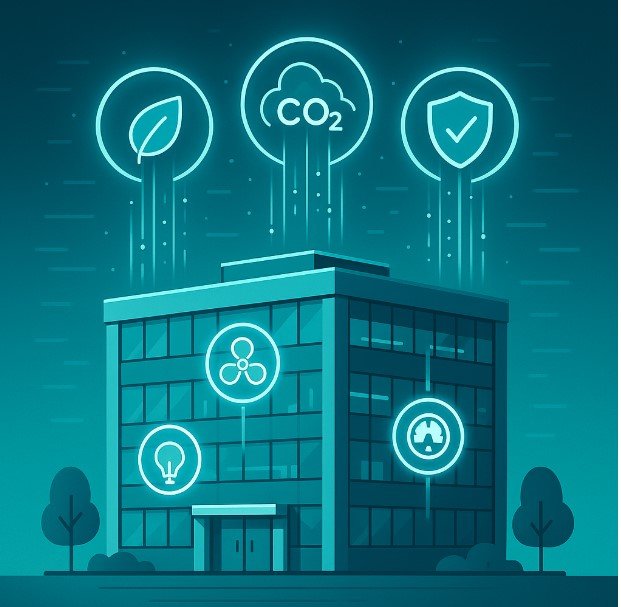
4) Verified ESG & insurer-ready evidence
What we do: Turn operations data into GHG/energy/water/comfort KPIs aligned to CSRD / TCFD / GHG Protocol; produce audit-friendly packs with before/after traces.
Why it matters: “Green” is only credible when it’s measured, repeatable, and traceable—exactly what underwriting and government reporting require.
5) Scale playbook (from one site to thousands)
What we do: Reference integrations for major BMS vendors; repeatable onboarding; templated anomaly libraries; portfolio benchmarks; role-aware dashboards for brokers, risk engineers, and facility teams.
Why it matters: The cost curve bends only when onboarding is industrialized and outcomes are consistent.
Where the industry is heading—and how to ride the wave
P&C: alternative revenues + agile capital + prevention
Deloitte spotlights fee-based services and agile capital models (sidecars, cat bonds). Insurmatics underpins both:
Fee-based prevention: Offer clients continuous monitoring, anomaly triage, and ESG reporting subscriptions.
Risk transfer advantage: Better first-party data improves reinsurance terms and capital efficiency by evidencing reduced severity/frequency.
L&A: alliances and data-powered product innovation
As growth shifts and private credit strategies evolve, carriers need operational alpha:
For group & life: Building-level IAQ/comfort and occupancy patterns feed wellness and productivity programs; verified data supports embedded benefits, parametric add-ons, and new SME offerings.
For annuities and wealth-adjacent products: IoT-linked property risks shape prudent portfolio allocation and protection overlays.
Distribution: right-channel, right-now
Consolidation raises the bar for digital service. Insurmatics exposes partner APIs so brokers can:
Pull live risk signals during quote/bind.
Surface prevention recommendations as a differentiated advisory service.
Bundle “protection + prevention” in one narrative.
Cat risk & the protection gap: science, not slogans
With weather volatility, portfolio triage depends on ground truth. Satellite and model data are powerful—but on-premises IoT confirms conditions in real time (e.g., equipment stress, humidity creep). Carriers gain:
Faster FNOL and more accurate reserves.
Targeted inspections and surge staffing.
A credible story for regulators and communities.
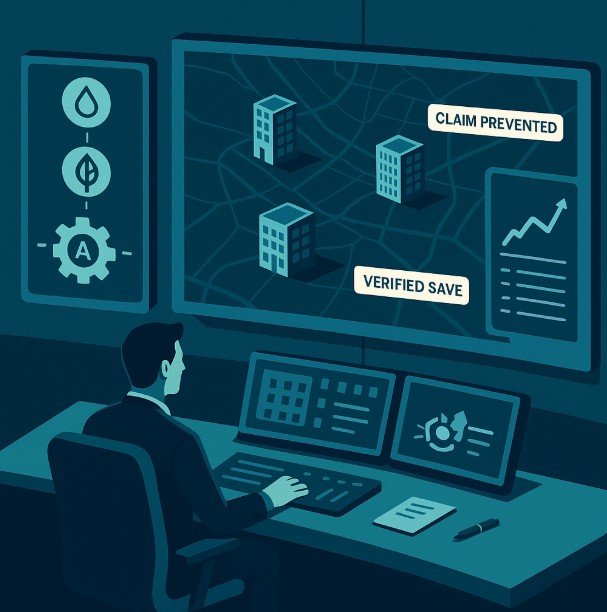
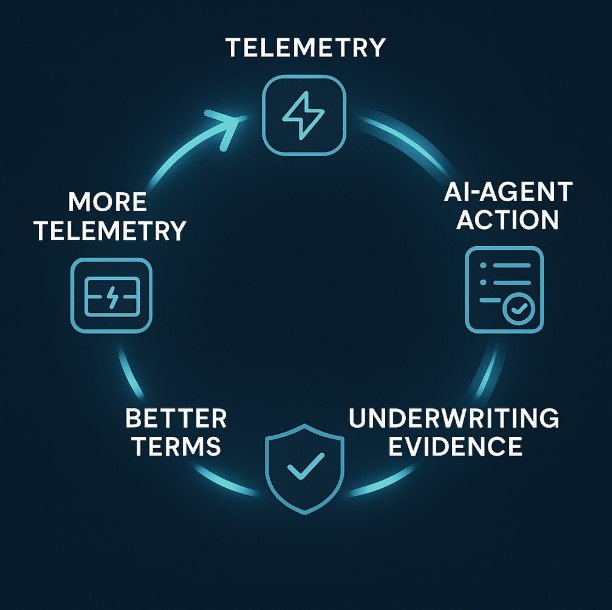
Real-time insurance command center:
IoT telemetry from buildings continuously feeds the AI-agent, turning data into preventive actions, verified savings, and evidence for better underwriting terms.
What to scale (concrete, near-term plays)
Commercial property: leak & humidity prevention at scale
Multisite sensor kits; agent detects risk signatures; auto-tickets maintenance; verifies outcome.
Typical impact: fewer large water losses, lower downtime, measurable energy savings.
Energy & IAQ optimization with ESG verification
Mapping BMS signals to GHG/comfort KPIs; auto-generate CSRD-ready evidence.
Typical impact: 5–15% avoidable energy reduction, 20–40% fewer IAQ excursions (site-dependent), accelerated reporting.
Broker enablement: risk snapshots in the quote
Pre-bind assessment powered by recent telemetry; flag uncontrolled risks; propose endorsement or improvement plan.
Typical impact: better selection, defensible pricing, lower surprises.
Parametric & usage-based add-ons
Trigger benefits on verified conditions (temperature/humidity thresholds, air quality, vibration).
Typical impact: differentiated products, higher retention, transparent claims triggers.
Claims acceleration with trusted telemetry
Event corroboration (e.g., line pressure drops, pump failure states); route to fast-track or investigation.
Typical impact: lower LAE, better CX, reduced fraud exposure.
Architecture that wins (and scales)
Edge + cloud: Local inference for latency-sensitive actions; cloud for fleet learning/benchmarking.
Open protocols, no lock-in: MQTT/Modbus/BACnet interop + vendor adapters.
Data contracts: Stable semantic layer that underwriting, actuarial, and facilities can share.
Agent guardrails: Human-in-the-loop, change logs, rollback, and policy constraints for safe autonomy.
Security by design: Zero-trust posture, certificate rotation, alerting for rogue devices, vendor risk reviews.
Observability: Pipeline health, data quality SLAs, model drift dashboards—if you can’t observe it, you can’t scale it.
Turning data into financial advantage.
Insurmatics in action: Netherlands + Canada pilots (pattern you can reuse)
Week 1–2 — Connect & define success: Sites, systems, access, KPIs (loss drivers + ESG).
Week 3–4 — Normalize & baseline: Data quality, anomaly libraries, benchmark peers.
Week 5–6 — AI-agent interventions: Prioritized fixes with ROI/impact; optional automated setpoints.
Week 7–8 — Verify & decide: Before/after pack; underwriting notes; reinsurance narrative; scale plan.
Common outcomes: measurable loss avoidance, lower energy/IAQ excursions, faster reporting, stronger broker story.
Conclusion: Walk the talk—make prevention your product
HBR’s warning about pilot fatigue and Deloitte’s agenda for 2026 point in the same direction: scale or be squeezed. The winning insurers won’t just price risk; they’ll shape it—with IoT telemetry, agentic AI, and credible ESG evidence that unlock better economics across underwriting, claims, reinsurance, and distribution.
Insurmatics is your scale engine: open protocols in, governed data through, AI actions out, with audit-ready proof. The pilot era is over. Let’s industrialize prevention.
📩 Ready to explore a portfolio pilot? [email protected]
Make Your Business Online By The Best No—Code & No—Plugin Solution In The Market.
30 Day Money-Back Guarantee
Say goodbye to your low online sales rate!
Q1: We’ve tried pilots—why will this scale?
A: Because the bottlenecks weren’t algorithms; they were data normalization, security, and workflows. Insurmatics focuses on plumbing + process first (protocols, governance, role design), then automation—so results repeat across sites.
Q2: How do we prove underwriting value, not just “nice-to-have” ESG?
A: We bind operational telemetry to loss drivers (e.g., moisture, IAQ, baseload). Reports show avoided events, severity deltas, and before/after traces. That’s underwriting evidence, not marketing.
Q3: Will this overload our facilities and risk teams?
A: No—AI agents prioritize actions by ROI, downtime, and risk reduction; integrate with work order tools; and close the loop so only high-value tasks reach humans.
Q4: How do brokers use this in distribution?
A: Via partner APIs or light portals: pre-bind risk snapshots, improvement plans, and ESG evidence in one sharable pack—positioning brokers as prevention partners.
Q5: What about privacy and security?
A: Role-based access, encryption, minimal-necessary data, audit trails, and vendor risk controls. We align to enterprise security standards and provide evidence packs for governance.
Q6: Where do we start?
A: Pick 5–10 representative buildings; connect meters/IAQ/leak; target two loss drivers; commit to an 8-week verify-and-scale cadence.